Preserved original writing. This article keeps the author’s original wording and figures. It may use provisional data, historical boundaries or figures awaiting correction. Read it as an archive record; the checked reference profiles use a separately reconciled dataset.
Data review note. Uttar Pradesh’s population figure does not reconcile with its stated national share. Multiple values in the original table require audit.
CLICK ON IMAGE TO ENLARGE
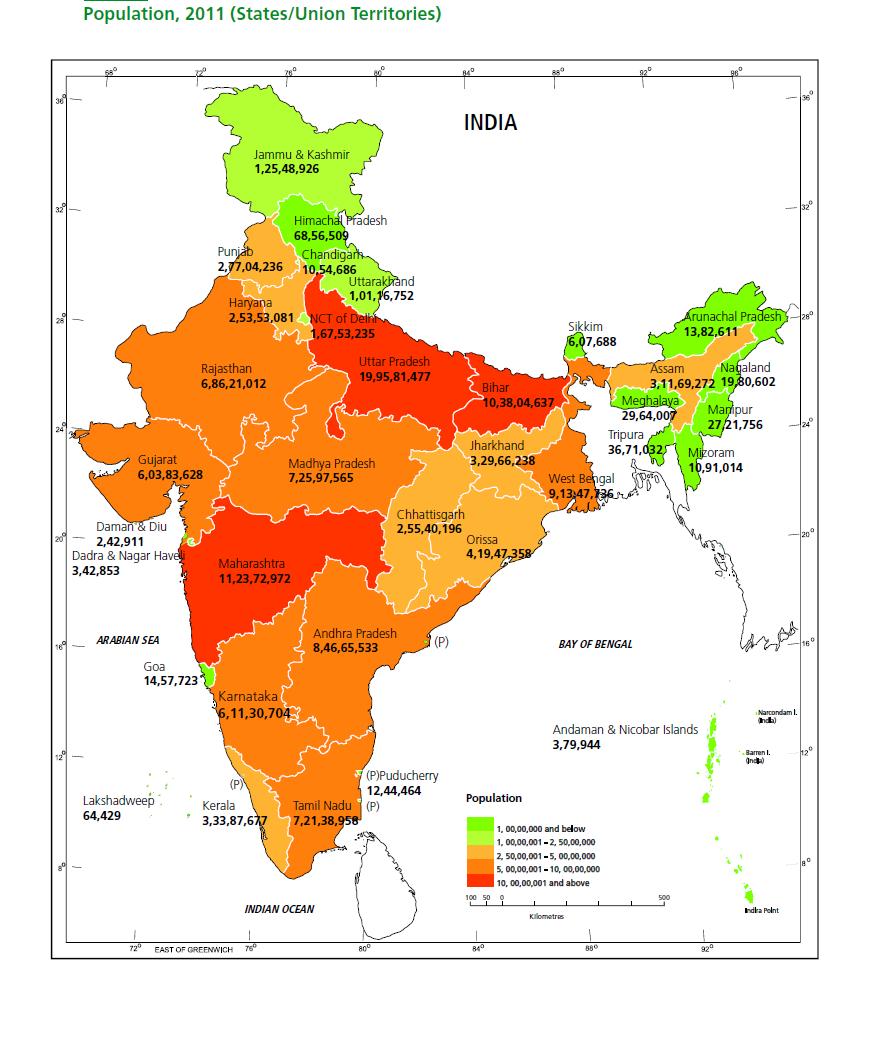
CLICK ON IMAGE TO ENLARGE
Population Map Of India, showing Total population of India, With the breakup population of every state and union territory, Colour Indicates density of population
Population of India as per 2011 census results
Population Of India
Population Map Of India, showing Total population of India, With the breakup population of every state and union territory, Colour Indicates density of population
Population of India as per 2011 census results
Rank
|
STATE \ UT
|
Population
|
% Population
|
Literacy Rate
|
Sex Ratio
|
Population Density
|
Total
|
INDIA
| 1,210, 193 , 422 |
100
|
940
|
382
| |
1
| Uttar Pradesh |
119 , 581 , 520
|
16.49 %
|
908
|
828
| |
2
| Maharashtra |
112 , 372 , 972
|
9.29 %
|
946
|
365
| |
3
| Bihar |
103 , 804 , 637
|
8.58 %
|
916
|
1102
| |
4
| West Bengal |
91 , 347 , 736
|
7.55 %
|
947
|
1030
| |
5
| Andhra Pradesh |
84 , 665 , 533
|
7.00 %
|
912
|
308
| |
6
| Tamil Nadu |
72 , 138 , 958
|
5.96 %
|
915
|
555
| |
7
| Madhya Pradesh |
72 , 597 , 565
|
6.00 %
|
930
|
236
| |
8
| Rajasthan |
68 , 621 , 012
|
5.67 %
|
926
|
201
| |
9
| Karnataka |
61 , 130 , 704
|
5.05 %
|
968
|
319
| |
10
| Gujarat |
60 , 383 , 628
|
4.99 %
|
918
|
308
| |
11
| Orissa |
41 , 947 , 358
|
3.47 %
|
905
|
269
| |
12
| Kerala |
33 , 387 , 677
|
2.76 %
|
1,084
|
859
| |
13
| Jharkhand |
32 , 966 , 238
|
2.72 %
|
947
|
414
| |
14
| Assam |
31 , 169 , 272
|
2.58 %
|
954
|
397
| |
15
| Punjab |
27 , 704 , 236
|
2.29 %
|
893
|
550
| |
16
| Chhattisgarh |
25 , 540 , 196
|
2.11 %
|
991
|
189
| |
17
| Haryana |
25 , 353 , 081
|
2.09 %
|
877
|
573
| |
18
| Jammu & Kashmir |
12 , 548 , 926
|
1.04 %
|
883
|
56
| |
19
| Uttarkhand |
10 , 116 , 752
|
0.84 %
|
963
|
189
| |
20
| Himachal Pradesh |
6 , 856 , 509
|
0.57 %
|
974
|
123
| |
21
| Tripura |
3 , 671 , 032
|
0.30 %
|
921
|
350
| |
22
| Meghalaya |
2 , 964 , 007
|
0.24 %
|
986
|
132
| |
23
| Manipur |
2 , 721 , 756
|
0.22 %
|
987
|
122
| |
24
| Nagaland |
1 , 980 , 602
|
0.16 %
|
931
|
119
| |
25
| Goa |
1 , 457 , 723
|
0.12 %
|
968
|
394
| |
26
| Arunachal Pradesh |
1 , 382 , 611
|
0.11 %
|
920
|
17
| |
27
| Mizoram |
1 , 091 , 014
|
0.09 %
|
975
|
52
| |
28
| Sikkim |
607 , 688
|
0.05 %
|
889
|
86
| |
UT 1
| Delhi |
16 , 753 , 235
|
1.38 %
|
866
|
9,340
| |
UT 2
| Pondicherry |
1 , 244 , 464
|
0.10 %
|
1,038
|
2,598
| |
UT 3
| Chandigarh |
1 , 054 , 686
|
0.09 %
|
818
|
9,252
| |
UT 4
| Andaman & Nicobar Islands |
379 , 944
|
0.03 %
|
878
|
46
| |
UT 5
| Dadra & Nagar Haveli |
342 , 853
|
0.03 %
|
775
|
698
| |
UT 6
| Daman & Diu |
242 , 911
|
0.02 %
|
618
|
2,169
| |
UT 7
| Lakshadweep |
64 , 429
|
0.01 %
|
946
|
2,013
|